{"name":"napari-cell-gater","display_name":"napari-cell-gater","visibility":"public","icon":null,"categories":["Annotation","Segmentation","Acquisition"],"schema_version":"0.3.0","on_activate":null,"on_deactivate":null,"contributions":{"commands":[{"id":"napari-cell-gater.SampleWidget","title":"napari-cell-gater","python_name":"cell_gater.widgets.sample_widget:SampleWidget","short_title":null,"category":null,"icon":null,"enablement":null}],"readers":null,"writers":null,"widgets":[{"command":"napari-cell-gater.SampleWidget","display_name":"napari-cell-gater","autogenerate":false}],"sample_data":null,"themes":null,"menus":{},"submenus":null,"keybindings":null,"configurations":{}},"package_metadata":{"metadata_version":"2.4","name":"napari-cell-gater","version":"0.5.2","dynamic":["license-file"],"platform":null,"supported_platform":null,"summary":"A napari plugin to perform cell marker gating for multiplexed immunofluorescent imaging","description":"# napari-cell-gater\n\n[](https://github.com/CosciaLab/napari-cell-gater/raw/main/LICENSE)\n[](https://pypi.org/project/napari-cell-gater)\n[](https://python.org)\n[](https://github.com/CosciaLab/napari-cell-gater/actions/workflows/test_and_deploy.yml)\n[](https://codecov.io/gh/CosciaLab/napari-cell-gater)\n\nA napari plugin to perform cell marker gating for multiplexed immunofluorescent imaging.\n\n`napari-cell-gater` is part of the [openDVP](https://github.com/CosciaLab/openDVP)\necosystem ([documentation](https://coscialab.github.io/openDVP/)). Use it to pick, per\nsample and per marker, the intensity threshold that separates positive from negative\ncells — while looking at the image, the segmentation mask and the intensity\ndistribution side by side.\n\n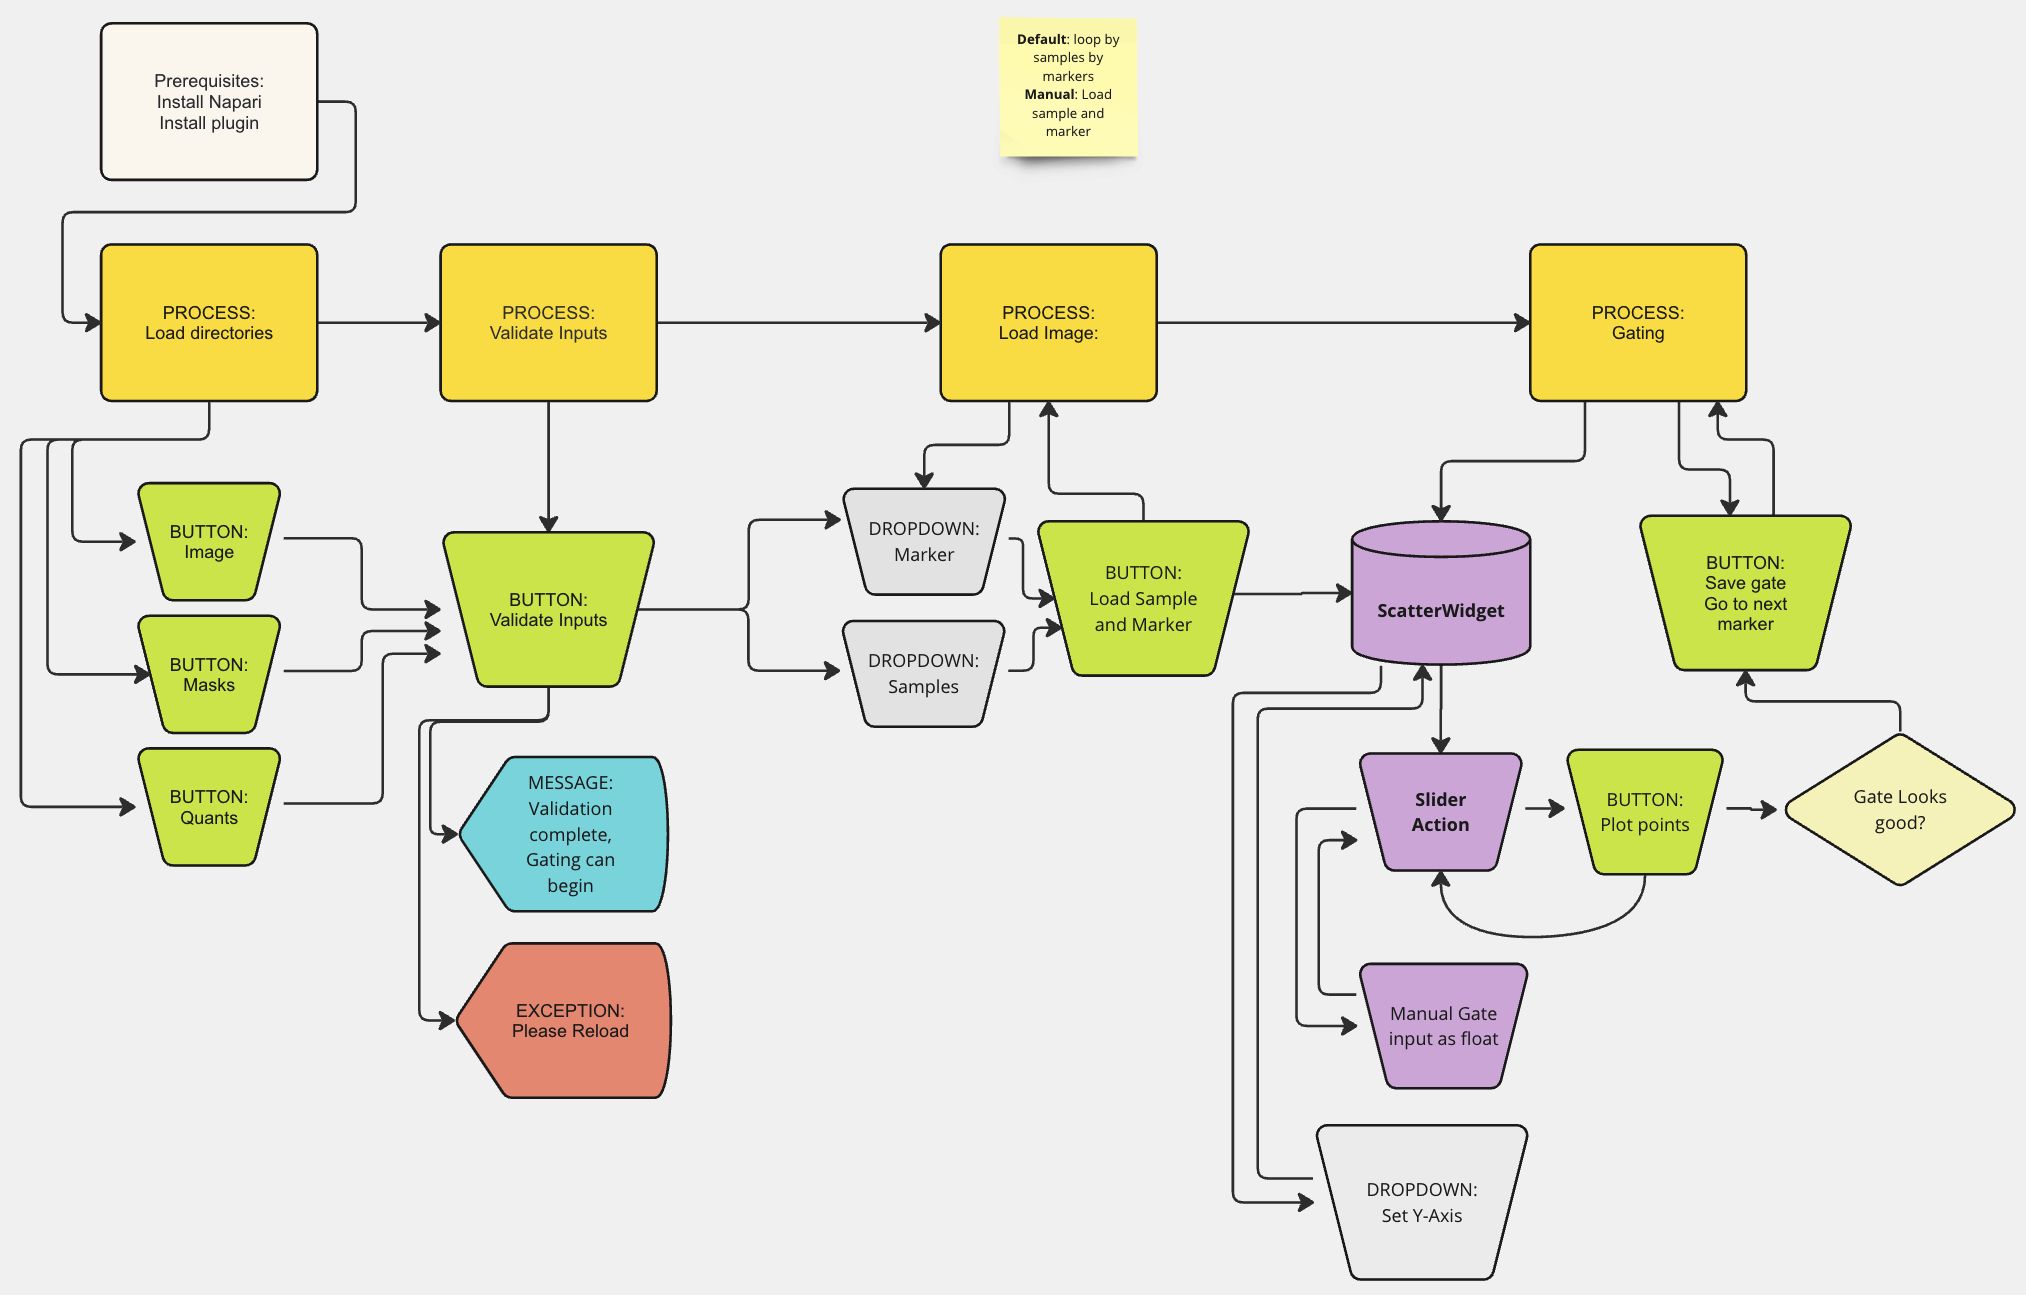\n\n----------------------------------\n\n## Installation\n\n`napari-cell-gater` needs Python 3.10–3.12 and a working [napari] installation\n(see the [napari installation guide](https://napari.org/stable/tutorials/fundamentals/installation)).\n\nWe recommend a fresh environment:\n\n```bash\nconda create -n cell-gater python=3.11\nconda activate cell-gater\npip install \"napari[all]\"\npip install napari-cell-gater\n```\n\nor, with [uv](https://docs.astral.sh/uv/):\n\n```bash\nuv venv --python 3.11 && source .venv/bin/activate\nuv pip install \"napari[all]\" napari-cell-gater\n```\n\nTo get the latest unreleased changes instead:\n\n```bash\npip install git+https://github.com/CosciaLab/napari-cell-gater.git@main\n```\n\nThen launch `napari` and open the plugin from **Plugins → napari-cell-gater**.\n\n## Inputs\n\nYou need three directories — images, segmentation masks and quantifications — with one\nfile per sample:\n\n| Directory | File per sample | Notes |\n|---|---|---|\n| images | `1.ome.tif` or `1.tif` | channel order must match the marker columns of the quantification csv |\n| masks | `1.tif` | label image; large masks can be slow to load |\n| quantifications | `1.csv` | one row per cell, one column per marker, plus morphology columns |\n\nAssumptions:\n\n- Files are named after the sample (`1`, `2`, … or any shared stem), and the **same**\n stem is used in all three directories.\n- Every sample must be present in all three directories.\n- Any extra file in those directories can make the plugin fail — keep them clean.\n\nA ready-to-run example dataset ships with the repository under\n[`tests/test_data/`](https://github.com/CosciaLab/napari-cell-gater/blob/main/tests/test_data) — 5 samples as `imgs/{1..5}.ome.tif`,\n`segs/{1..5}.tif` and `quants/{1..5}.csv`. Point the plugin at those three folders to\ntry it out without preparing your own data.\n\n## Output\n\nGates are written to a csv with one row per sample/marker pair — see\n[`gates_example.csv`](https://github.com/CosciaLab/napari-cell-gater/blob/main/gates_example.csv):\n\n```csv\nsample_id,marker_id,gate_value\n68,Rabbit IgG,3478.531304347826\n68,Goat IgG,0.0\n```\n\nGate values are always saved in **linear** space, even when plotting in log10.\nThe same file can be read back with **Load existing gates**.\n\n## How to use\n\n1. Load your three directories with **Load quantifications dir**, **Load image dir**\n and **Load mask dir**. Optionally use **Opt: Load channel map** to supply an explicit\n channel-to-marker mapping.\n2. Set **Select lowerbound marker column** and **Select upperbound marker column** to\n the first and last quantification columns you want to gate. Pick the same bounds\n every session if you plan to save and reload gates.\n3. Optionally adjust **Remove markers with prefix** (default `DNA, DAPI`) to drop\n nuclear channels from the marker list.\n4. Click **Validate input**. On success the gating controls appear; on failure fix the\n inputs and validate again.\n5. Choose a **sample** and a **marker** from the dropdowns. Three layers load: the\n reference channel (**Select reference channel**), the segmentation mask, and the\n channel being gated. A plot of marker intensity (x) against **Choose Y-axis**\n (default `Area`) appears, with a slider underneath whose position is drawn as a\n vertical line.\n6. Tune the view: switch **Plot type** to `Hexbin` for dense clusters, and\n **Logarithmic scale** to `Yes` to plot in log10 (often easier to read). Adjust image\n contrast from the napari layer controls at the top left.\n7. Drag the slider to the threshold you think is correct, or type a value into\n **Manual gate input** and click **Set gate manually**.\n8. Click **Plot Points** to overlay the cells the current gate calls positive.\n9. Repeat steps 6–8 until you are satisfied, then click **Save Gate**. The first save\n asks where to write the gates csv; later saves reuse that path. Go back to step 5 for\n the next marker or sample.\n\n## Contributing\n\nContributions are very welcome. To set up a development install:\n\n```bash\ngit clone https://github.com/CosciaLab/napari-cell-gater.git\ncd napari-cell-gater\npip install -e \".[dev]\"\npytest\n```\n\nPlease ensure test coverage at least stays the same before you submit a pull request.\n\n## Citation\n\n`napari-cell-gater` is developed as part of the [openDVP](https://github.com/CosciaLab/openDVP)\necosystem. Until the paper is out, please cite this repository and the openDVP\ndocumentation at .\n\n\n\n## License\n\nDistributed under the terms of the [BSD-3] license,\n\"napari-cell-gater\" is free and open source software.\n\n## Issues\n\nIf you encounter any problems, please [file an issue] along with a detailed description.\n\n[napari]: https://github.com/napari/napari\n[BSD-3]: http://opensource.org/licenses/BSD-3-Clause\n[file an issue]: https://github.com/CosciaLab/napari-cell-gater/issues\n","description_content_type":"text/markdown","keywords":"napari,gating,imaging,proteomics,opendvp","home_page":null,"download_url":null,"author":null,"author_email":"Jose Nimo , Wouter-Michiel Vierdag ","maintainer":null,"maintainer_email":"Jose Nimo , Wouter-Michiel Vierdag ","license":null,"classifier":["Development Status :: 4 - Beta","Framework :: napari","Intended Audience :: Science/Research","Operating System :: OS Independent","Programming Language :: Python :: 3","Programming Language :: Python :: 3 :: Only","Programming Language :: Python :: 3.10","Programming Language :: Python :: 3.11","Programming Language :: Python :: 3.12","Topic :: Scientific/Engineering :: Image Processing"],"requires_dist":["numpy","magicgui","qtpy","scikit-image","loguru","napari","dask-image","matplotlib","pandas","packaging","pytest; extra == \"dev\"","pytest-cov; extra == \"dev\"","pytest-qt; extra == \"dev\"","pre-commit; extra == \"dev\"","ruff; extra == \"dev\"","tox; extra == \"dev\"","hatchling; extra == \"dev\"","PyQt5; extra == \"dev\"","sphinx; extra == \"dev\"","myst-parser; extra == \"dev\"","sphinx-rtd-theme; extra == \"dev\"","twine; extra == \"dev\""],"requires_python":">=3.10","requires_external":null,"project_url":["Homepage, https://github.com/CosciaLab/napari-cell-gater","Source, https://github.com/CosciaLab/napari-cell-gater","Bug Tracker, https://github.com/CosciaLab/napari-cell-gater/issues","User Support, https://github.com/CosciaLab/napari-cell-gater/issues","Documentation, https://github.com/CosciaLab/napari-cell-gater#readme"],"provides_extra":["dev"],"provides_dist":null,"obsoletes_dist":null},"npe1_shim":false}